
How to improve web app performance 📈
In this article, let's look at some techniques to improve load time, focusing on performance metrics.

On this post
Introduction
Performance is one of the most critical factors for the success of a web application. A slow application can hurt the user experience and lower the conversion rate. That’s why developers need to always keep an eye on the performance of their applications and adopt good practices to make sure they load quickly and run efficiently.
Sobre performance no Front-end é importante cuidar de coisas como:
- minificação/otimização
- tamanho de imagens
- code splitting
- lazy load
- cache
- etc
Também observe "third-party scripts", principalmente injetados com GTM e afins. Podem estar silenciosamente drenando…
Performance is a pretty broad subject and involves many aspects, like load time, response time, resource usage, and more. In this article, we’ll cover some common practices to improve the load time of a web application in particular.
Performance metrics
Before you start optimizing an application, it’s important to understand which performance metrics matter most. There are plenty of tools that can help you measure the performance of a web application, like Lighthouse, an open source tool built by Google that analyzes the performance of a web page and gives you optimization suggestions.
Some of the most important metrics Lighthouse analyzes are:
- First Contentful Paint (FCP): how long it takes for the first content to show up on screen
- Speed Index: measures how quickly the above-the-fold content is displayed
- Time to Interactive (TTI): how long it takes for the page to become interactive
- Total Blocking Time (TBT): total time the page is blocked and doesn’t respond to user interactions
- Cumulative Layout Shift (CLS): measures the visual stability of the page
They’re important for understanding how the application is performing and for spotting bottlenecks that may be hurting the user experience.
Lighthouse gives you an overall performance score based on these metrics, for both desktop and mobile, although mobile metrics are the more relevant ones to use as a reference.
Here’s an example of the metrics for this very site you’re reading this article on:
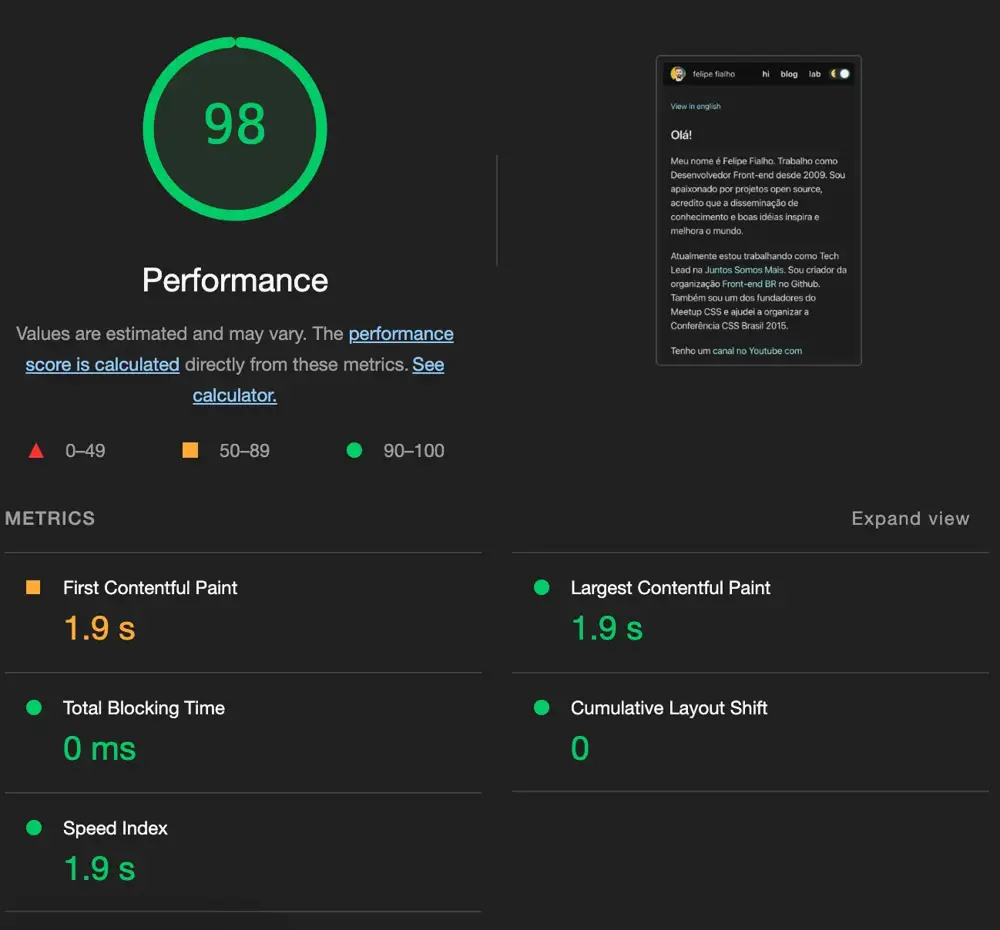
We can see the performance score is pretty high, but there’s still room for improvement, especially in First Contentful Paint (FCP), which could be optimized to load faster.
INP (Interaction to Next Paint)
A metric that has been gaining prominence is Interaction to Next Paint (INP), which measures how long it takes for the page to respond to a user interaction and display the next content on screen.
It became stable in March 2024, joining the Core Web Vitals package, a set of performance metrics that Google considers essential for a good user experience.
The main change was that First Input Delay (FID) is going away, replaced by Interaction to Next Paint (INP), a broader metric that considers not only the page’s response time, but also the time it takes to display the next content.
INP evaluates response time in a few situations, like:
- Adding items to a shopping cart
- Response time when clicking a button
- Response time when filling out a form, like a login
It’s worth noting that part of these situations depend on the response time of APIs and the back-end, so make sure those resources are optimized too.
DevTools
Besides the metrics generated by Lighthouse, the “performance” tab in DevTools gives you good insights, showing the impact of each script on loading and using the application. Checking the “waterfall” in the “network” tab can also help you understand the impact of requests and resource downloads.
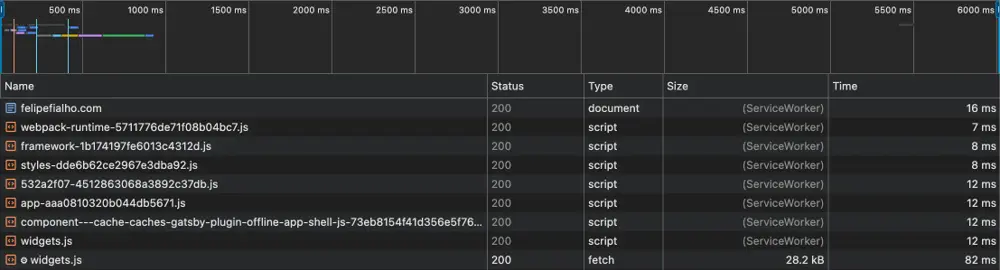
This is especially useful for understanding the loading order of things and whether any requests are blocking the loading of other resources.
Continuous monitoring
Besides measuring the application’s performance at a point in time, it’s important to monitor it continuously. Monitoring tools like Sentry and New Relic can help you identify performance issues in real time and give you insights into how the application is doing, plus alert you about potential problems before they affect users.
Another advantage is that these tools base their metrics on real user data, which can give a more accurate picture of the application’s performance across different scenarios and conditions.
Improving the application’s performance
Minification/optimization
Minifying and optimizing CSS and JavaScript files is a fundamental practice that’s now built into every bundler, so part of the work is already done automatically.
But remember: a good chunk of the work is still the developer’s responsibility. Avoid unnecessary imports and remove dead code to reduce bundle size and make sure only the essential code gets sent to the client.
Blocking resources
Avoid blocking resources, like scripts that prevent the page from rendering while they load.
Non-critical scripts can be loaded asynchronously or deferred, freeing the browser to render the main content quickly. A common practice is to load scripts at the end of the body, but that may not be enough. Consider techniques like “defer” and “async” for non-critical scripts, or even loading scripts dynamically only when needed.
Also watch out for “third-party scripts”, especially the ones injected through Google Tag Manager and the like, which may be silently draining your application’s performance.
One option is to load these scripts through web workers, which are threads that run in the background and don’t block the main thread, letting the application keep responding while the scripts load.
The partytown lib can make this process a lot easier: just load its script and configure your third-party scripts to load this way:
<script type="text/partytown" src="https://example.com/analytics.js"></script>

<script type="text/partytown">
  /* Inlined Third-Party Script */
</script>
Image size
Images are one of the biggest performance villains.
Whenever possible, prefer lighter formats like WebP or even optimized JPG. Also, avoid loading images at resolutions larger than needed (this is absolutely essential!) and use lazy loading on images outside the viewport.
There’s no point optimizing all the CSS and JS if the images are heavy and slow to load, especially because they compete with other resources loading in parallel.
If the site is static, consider using tools like ImageResizer to optimize images manually before uploading them to the server, or automate the process with image optimization plugins that can be integrated into your build process.
Frameworks like Next.js and Gatsby.js already have built-in image optimization, which makes the whole process a lot easier.
If images are added through a CMS, consider adding an automatic optimization step, like a plugin that optimizes images as they’re uploaded to the server. Some CDN and cloud platform tools like Akamai and Cloudinary also offer automatic image optimization solutions.
And of course, good old common sense is an essential part of the process. If the image sits inside a 100x100 pixel card, it makes no sense to load a 2000x2000 pixel image, right? No amount of optimization will fix that.
 it fits, but it’s not ideal
Preload
Critical images, used on the page’s first load, like inside a Hero or Banner, can be preloaded using the preload attribute:
<link rel="preload" fetchpriority="high" as="image" href="hero.jpg" type="image/jpeg">This makes the image load with priority before it’s displayed on screen, improving the page’s load time and lowering the LCP (Large Contentful Paint).
Latency, cache and CDN (Content Delivery Network)
Using a CDN to serve static content is a common practice to reduce latency and improve the application’s load time. CDNs are networks of geographically distributed servers that store copies of static content, like images, videos and CSS and JS files, and serve that content from the server closest to the user, reducing latency and improving load time.
Also, it’s important to configure the cache for static resources properly (and with great care!!) so the browser can store local copies of the files and avoid making unnecessary requests to the server.
You can also set up features like service workers to cache resources and let the application work offline, which can significantly improve the user experience.
Keep in mind that a badly configured cache can be worse than having no cache at all. If the cache is too aggressive, users might not see the latest updates to the application, which can be frustrating. I talked about this in my article about cache pitfalls.
Critical path
The critical path is the route the browser has to take to render the page.
The more efficiently the critical resources are made available, the faster the page will render. That includes the HTML, CSS and JavaScript needed to render the content visible in the viewport.
An interesting alternative (but one to be used carefully) is “critical CSS”, which is the CSS needed to render the content visible on screen. It can be done manually or automated with tools like Critical.
That way, this critical CSS is inlined in the HTML, while the rest of the CSS is loaded asynchronously, improving the page’s render time.
This directly affects First Contentful Paint (FCP) and Speed Index, which are important metrics for the user experience.
Tree shaking
Tree shaking is a technique that breaks chunks (blocks of code) into smaller pieces and removes the code that isn’t used, reducing bundle size and improving the application’s load time.
It’s a common practice in modern bundlers like Webpack and Rollup, but your code needs to be written in a modular way for tree shaking to work properly.
One of the main villains of tree shaking is importing whole modules, which can pull in more code than necessary. Prefer specific imports to reduce bundle size and make tree shaking more effective.
In other words, stop using barrel files in your projects and prefer specific imports.
Instead of creating an index.js file with all the exports:
// components/index.js
export { default as Button } from './Button';
export { default as Input } from './Input';
export { default as Select } from './Select';
And calling it with
// App.js
import { Button, Input, Select } from 'components';
Prefer importing directly what you need:
// App.js
import Button from 'components/Button';
import Input from 'components/Input';
import Select from 'components/Select';
It looks like a less elegant solution, but it’s much more efficient and helps tree shaking work properly.
Keep barrel files only for external packages that can be properly configured to export in a more granular way, making sure tree shaking works correctly.
Lazy loading
Lazy loading is a technique that defers the loading of resources like scripts and images until they’re needed.
That way, only the resources essential for the initial view of the page are loaded, and the rest is loaded asynchronously as the user interacts with the page.
When used with bundles that have gone through tree shaking, lazy loading will significantly improve the application’s load time, especially on pages with lots of content and resources, since those small chunks will only be loaded when needed. It can also be used together with the Intersection Observer API to load resources as they enter the viewport.
Both tree shaking and lazy loading directly affect the Large Contentful Paint (LCP) and First Contentful Paint (FCP) metrics, both of which carry a lot of weight in the Lighthouse performance score.
Conclusion
The focus of this article was to show some techniques to improve the load time of a web application, but it’s important to remember that performance is a complex subject that involves many other aspects, including runtime, meaning what happens after the page has already loaded.
Maybe a Part 2 about that will come in the future? 😁
That’s it for today, I hope it was useful.
TMJ! (Let’s go, team!)